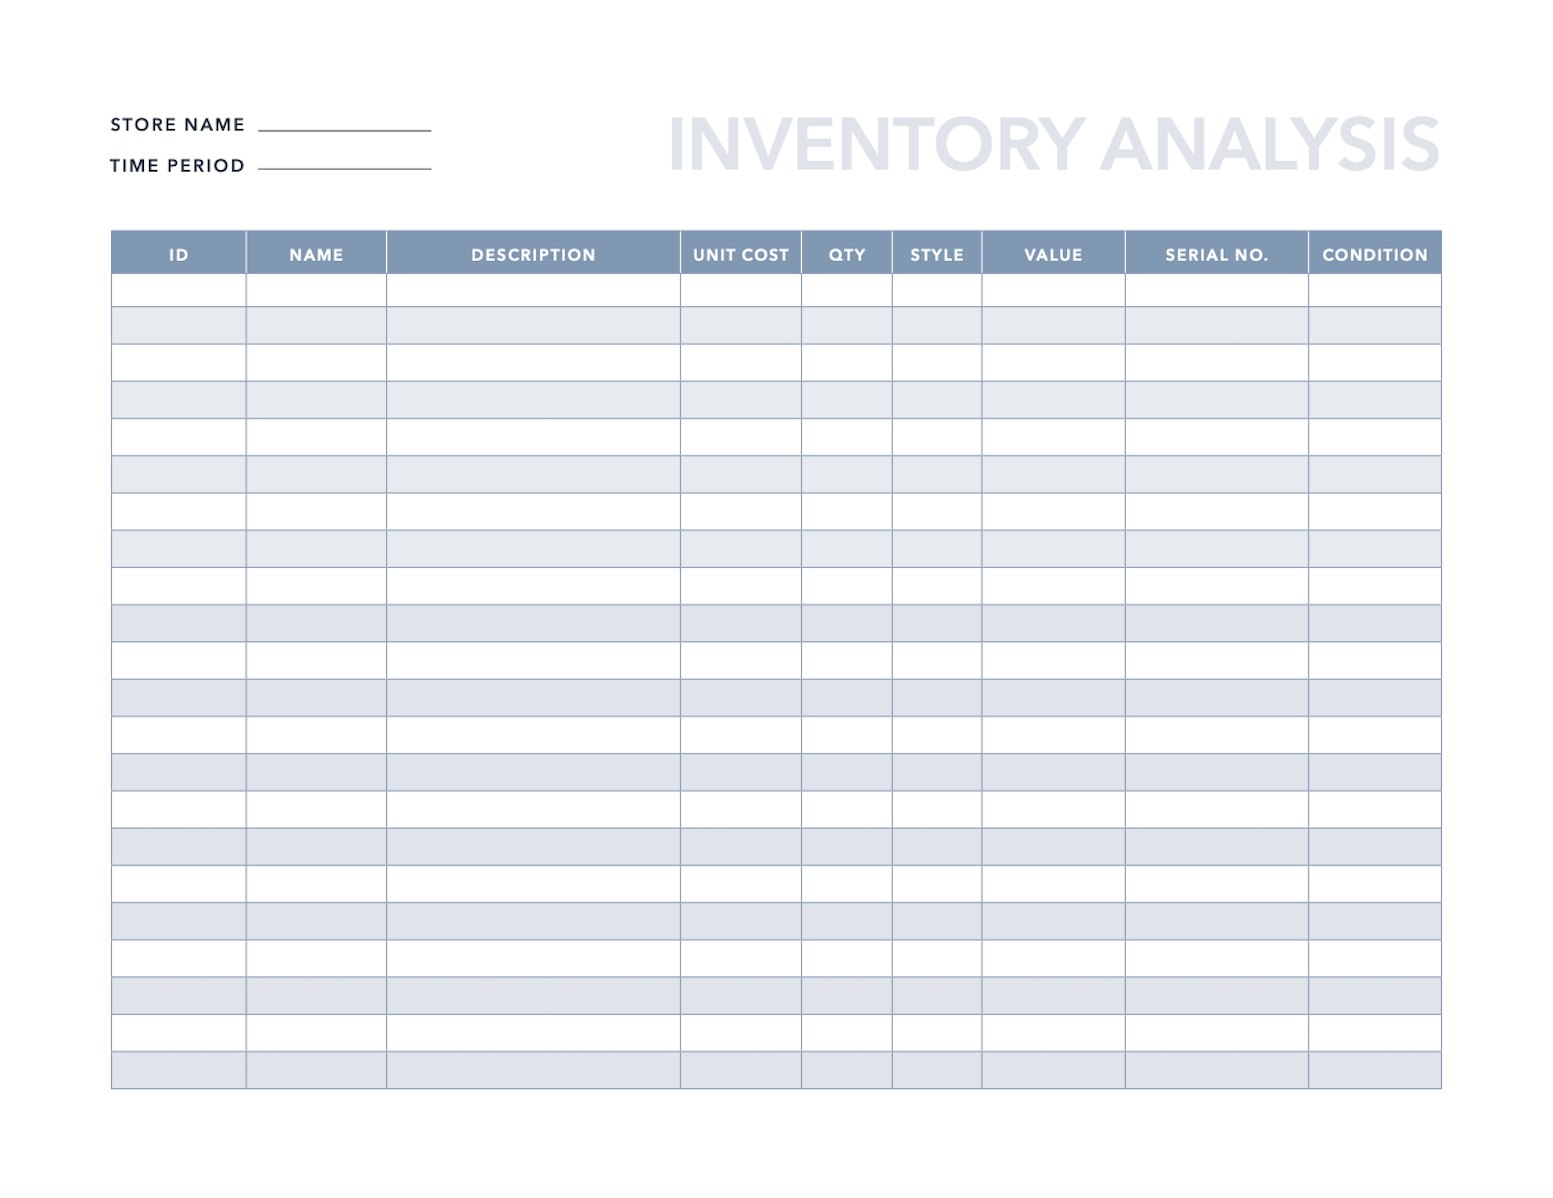
Business inventory charts are essential tools for businesses of all sizes. They provide a visual representation of inventory data, which can help businesses track inventory levels, identify trends, and make informed decisions about inventory management.
There are many different types of business inventory charts, each with its own advantages and disadvantages. The most common types of charts include bar charts, line charts, and pie charts. Bar charts are useful for comparing inventory levels over time, while line charts are useful for showing trends in inventory levels.
Pie charts are useful for showing the proportion of inventory that is made up of different items.
Interpreting Business Inventory Charts

Business inventory charts provide valuable insights into the management of a company’s stock. These charts display data on the quantity and value of inventory held over a specific period. By analyzing these charts, businesses can identify trends, make informed decisions, and optimize their inventory levels.
Key Metrics, Business inventory charts
The key metrics to consider when interpreting business inventory charts include:
- Inventory Turnover Ratio:This ratio measures the efficiency of inventory management by calculating how many times inventory is sold and replaced within a specific period.
- Days Sales of Inventory (DSI):This metric indicates the average number of days it takes to sell the inventory on hand. A high DSI may indicate overstocking or slow sales.
- Inventory Value:The total value of inventory held by the business, including raw materials, work-in-progress, and finished goods.
Trends
Business inventory charts can also reveal trends in inventory management, such as:
- Seasonal Fluctuations:Many businesses experience seasonal variations in inventory levels due to changes in demand. These fluctuations can be identified by observing patterns in the charts.
- Growth or Decline:Inventory charts can show whether a business is experiencing growth or decline in its inventory levels, which can indicate changes in demand or production capacity.
- Overstocking or Understocking:The charts can help businesses identify periods of overstocking (excess inventory) or understocking (insufficient inventory), which can impact profitability and customer satisfaction.
Concluding Remarks

Business inventory charts are a valuable tool for businesses of all sizes. They can help businesses track inventory levels, identify trends, and make informed decisions about inventory management. By using business inventory charts, businesses can improve their inventory management practices and reduce costs.
